In the table below you will find the set of data being
analyzed in this study.
|
Per Capita
Consumption of All Cheese - US
|
|
|
Year
|
Value
|
|
1970
|
11.3678
|
1971
|
12.0292
|
|
1972
|
13.0017
|
|
1973
|
13.4869
|
|
1974
|
14.407
|
|
1975
|
14.2703
|
|
1976
|
15.5113
|
|
1977
|
15.9917
|
|
1978
|
16.834
|
|
1979
|
17.1602
|
|
1980
|
17.5298
|
|
1981
|
18.1766
|
|
1982
|
19.902
|
|
1983
|
20.567
|
|
1984
|
21.4768
|
|
1985
|
22.5441
|
|
1986
|
23.1165
|
|
1987
|
24.0976
|
|
1988
|
23.7123
|
|
1989
|
23.793
|
|
1990
|
24.611
|
|
1991
|
24.9356
|
|
1992
|
25.855
|
|
1993
|
26.0283
|
|
1994
|
26.5491
|
|
1995
|
26.9136
|
|
1996
|
27.3115
|
|
1997
|
27.5218
|
|
1998
|
27.7493
|
|
1999
|
28.9516
|
|
2000
|
29.8011
|
|
2001
|
30.0414
|
|
2002
|
30.515
|
|
2003
|
30.5571
|
|
2004
|
31.2812
|
|
2005
|
31.7599
|
|
2006
|
32.6984
|
|
2007
|
33.1873
|
|
2008
|
32.4838
|
This report is a statistical analysis of the Per Capita Consumption of All Cheese in the United States each year from 1970 to 2008. The amount of consumption per person of cheese is measured in pounds. The explanatory variable (x) of time (year) is graphed versus the response variable (y) of pounds of consumption on the scatter plot below.
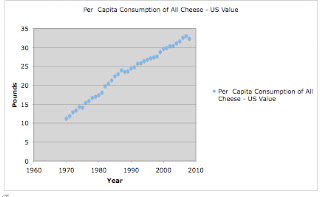
As made apparent by the graph, since 1970, the amount of
consumption of cheese per capita has continued to rise in a positive direction
with a minimum consumption of 11.3678 pounds in 1970 and a maximum of 33.1873
pounds in 2007. The scatter has a positive direction and slope, with a fairly
linear shape. The plot is also very strong with an r value of .9926672127 which represents an almost perfectly linear
graph (a perfect one being where r=1.)
From the data and this graph we
can record the Five Number Summary of the data which is:
Min=11.3678
Q1=17.1602
Median=24.0976
Q3=28.9516
Max=33.1873
From the five number summary, we
can conclude that the IQR of the data for Pounds of Consumption= 11.7914. The
data also has a range of 21.8195. There are no clear outliers in the data, so
using the range would be fine for this example. The mean and median are very
close in the data as well showing that the range would be fine to use. The
mean= 23.2750718. Also, the standard deviation from the mean of around 23.28 is
6.559931092.
Below is a picture of the LSRL
(Least Squares Regression Line) of the data.

From this line as well as the
Residual Plot (see below), it is evident that the straight-line LSRL model is
the best fitting model for this group of data.

The Residual Plot pictured above has no clear pattern,
further proving that the LSRL model is the best fitting one for the data.
In order to predict future values of Per Capita Consumption
of All Cheese per year as well as to interpret the actual value of a point
versus its predicted value by the LSRL, you can use the equation:
Y[hat] (pounds)= a+b (year)
Where…
a=11.85256896
b=.5711251417
Also, according to the value of r2 in accordance
with this data, the LSRL properly accounts for 98.54% of the data.
Overall, the data represented for the Per Capita Consumption
of All Types of Cheese in the United States each year from 1970 to 2008, is a fairly
linear set of data that seems like it will continue in a positive direction for
upcoming years. However, as with any form of extrapolation, it is dangerous to
predict too far in advanced because we do not know when this data will plateau
or go down due to a lurking variable that we may not recognize at this time.